

Fundamental, Technical and Macro Tools to Value Digital Assets
Fundamental, Technical and Macro Tools to Value Digital Assets
In this report we will go through some of the best fundmental metrics you can use to spot the strongest projects. Having a basic understanding of what to look for like, high dev activity, TVL, user...

Fundamental Analysis
Developer Activity
Developer engagement is a solid indicator of a project's health and longevity. Resources such as Electric Capital and Santiment offer data on this. Typically, projects with at least 30 full-time developers are deemed more reliable, indicating lively development and a commitment to the growth and adoption of the network.
Let’s take a look at Electric Capital’s Developer Report
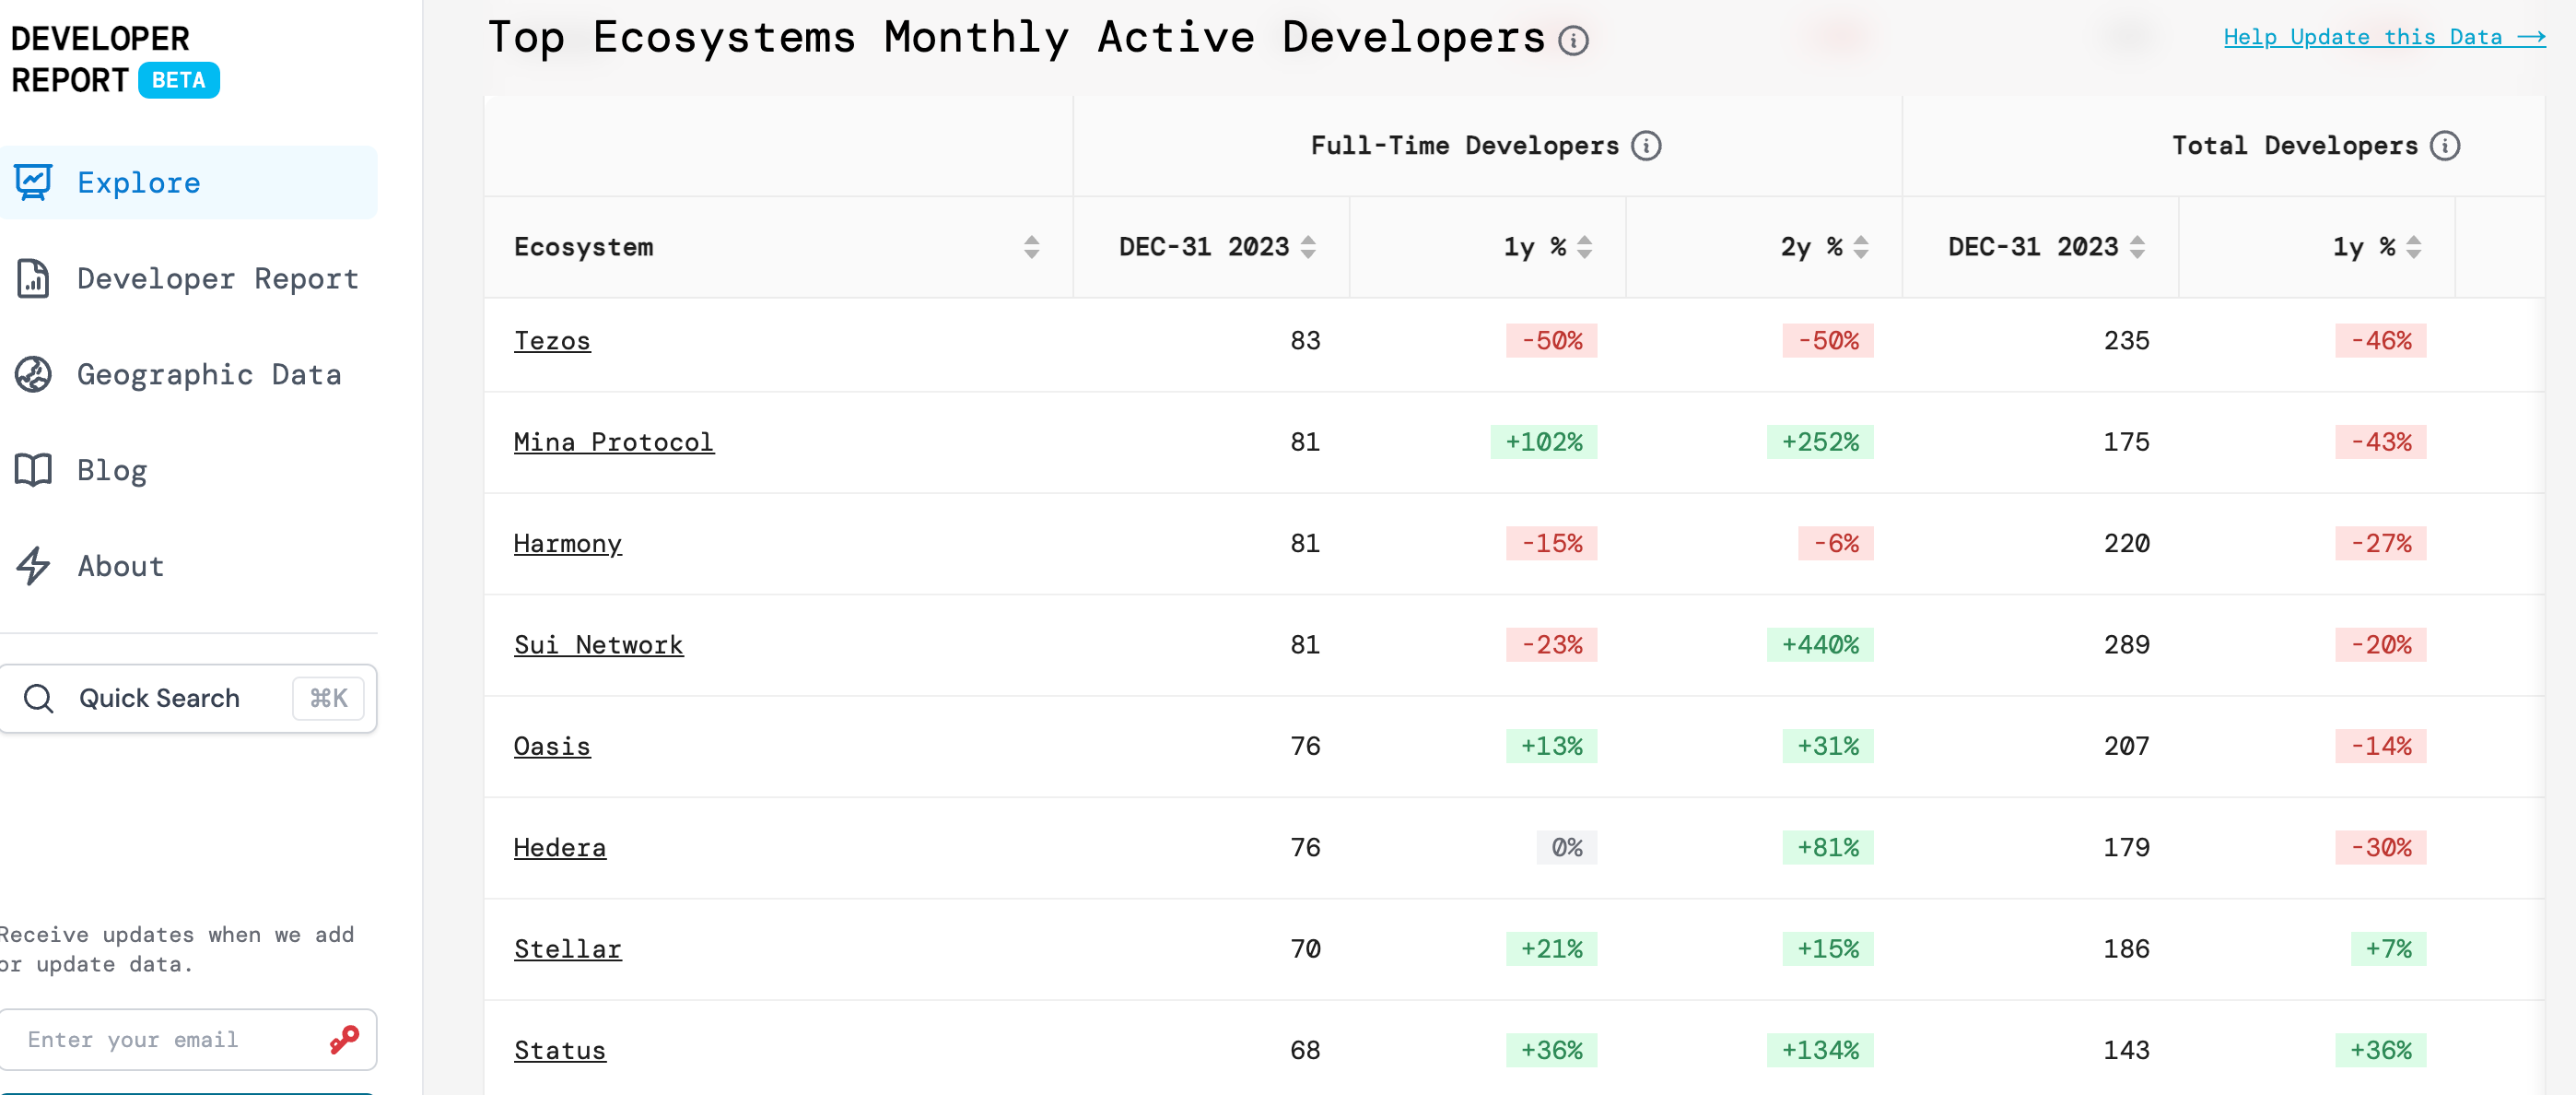
We can see that both Sui Network and Oasis Network (Rose) have a strong increase in full-time developers over the past 2 years. This indicates the ecosystems are being actively invested in and developers are choosing to build there in the hope of building out robust and user-friendly apps that attract users to their network. Typically higher development projects tend to outperform those with lower development. Investors can use this to thier edge by investing in high-dev activity projects that are undervalued against the market. It can be a very useful metric to spot future outperformers.
Total Value Locked (TVL)
TVL measures the total capital committed within a project, reflecting user trust and the project’s functional appeal. A high TVL suggests active participation and a sustainable yield environment for user assets.
For this metric, I liked to use Defi Llama and Sort by ‘Chains’
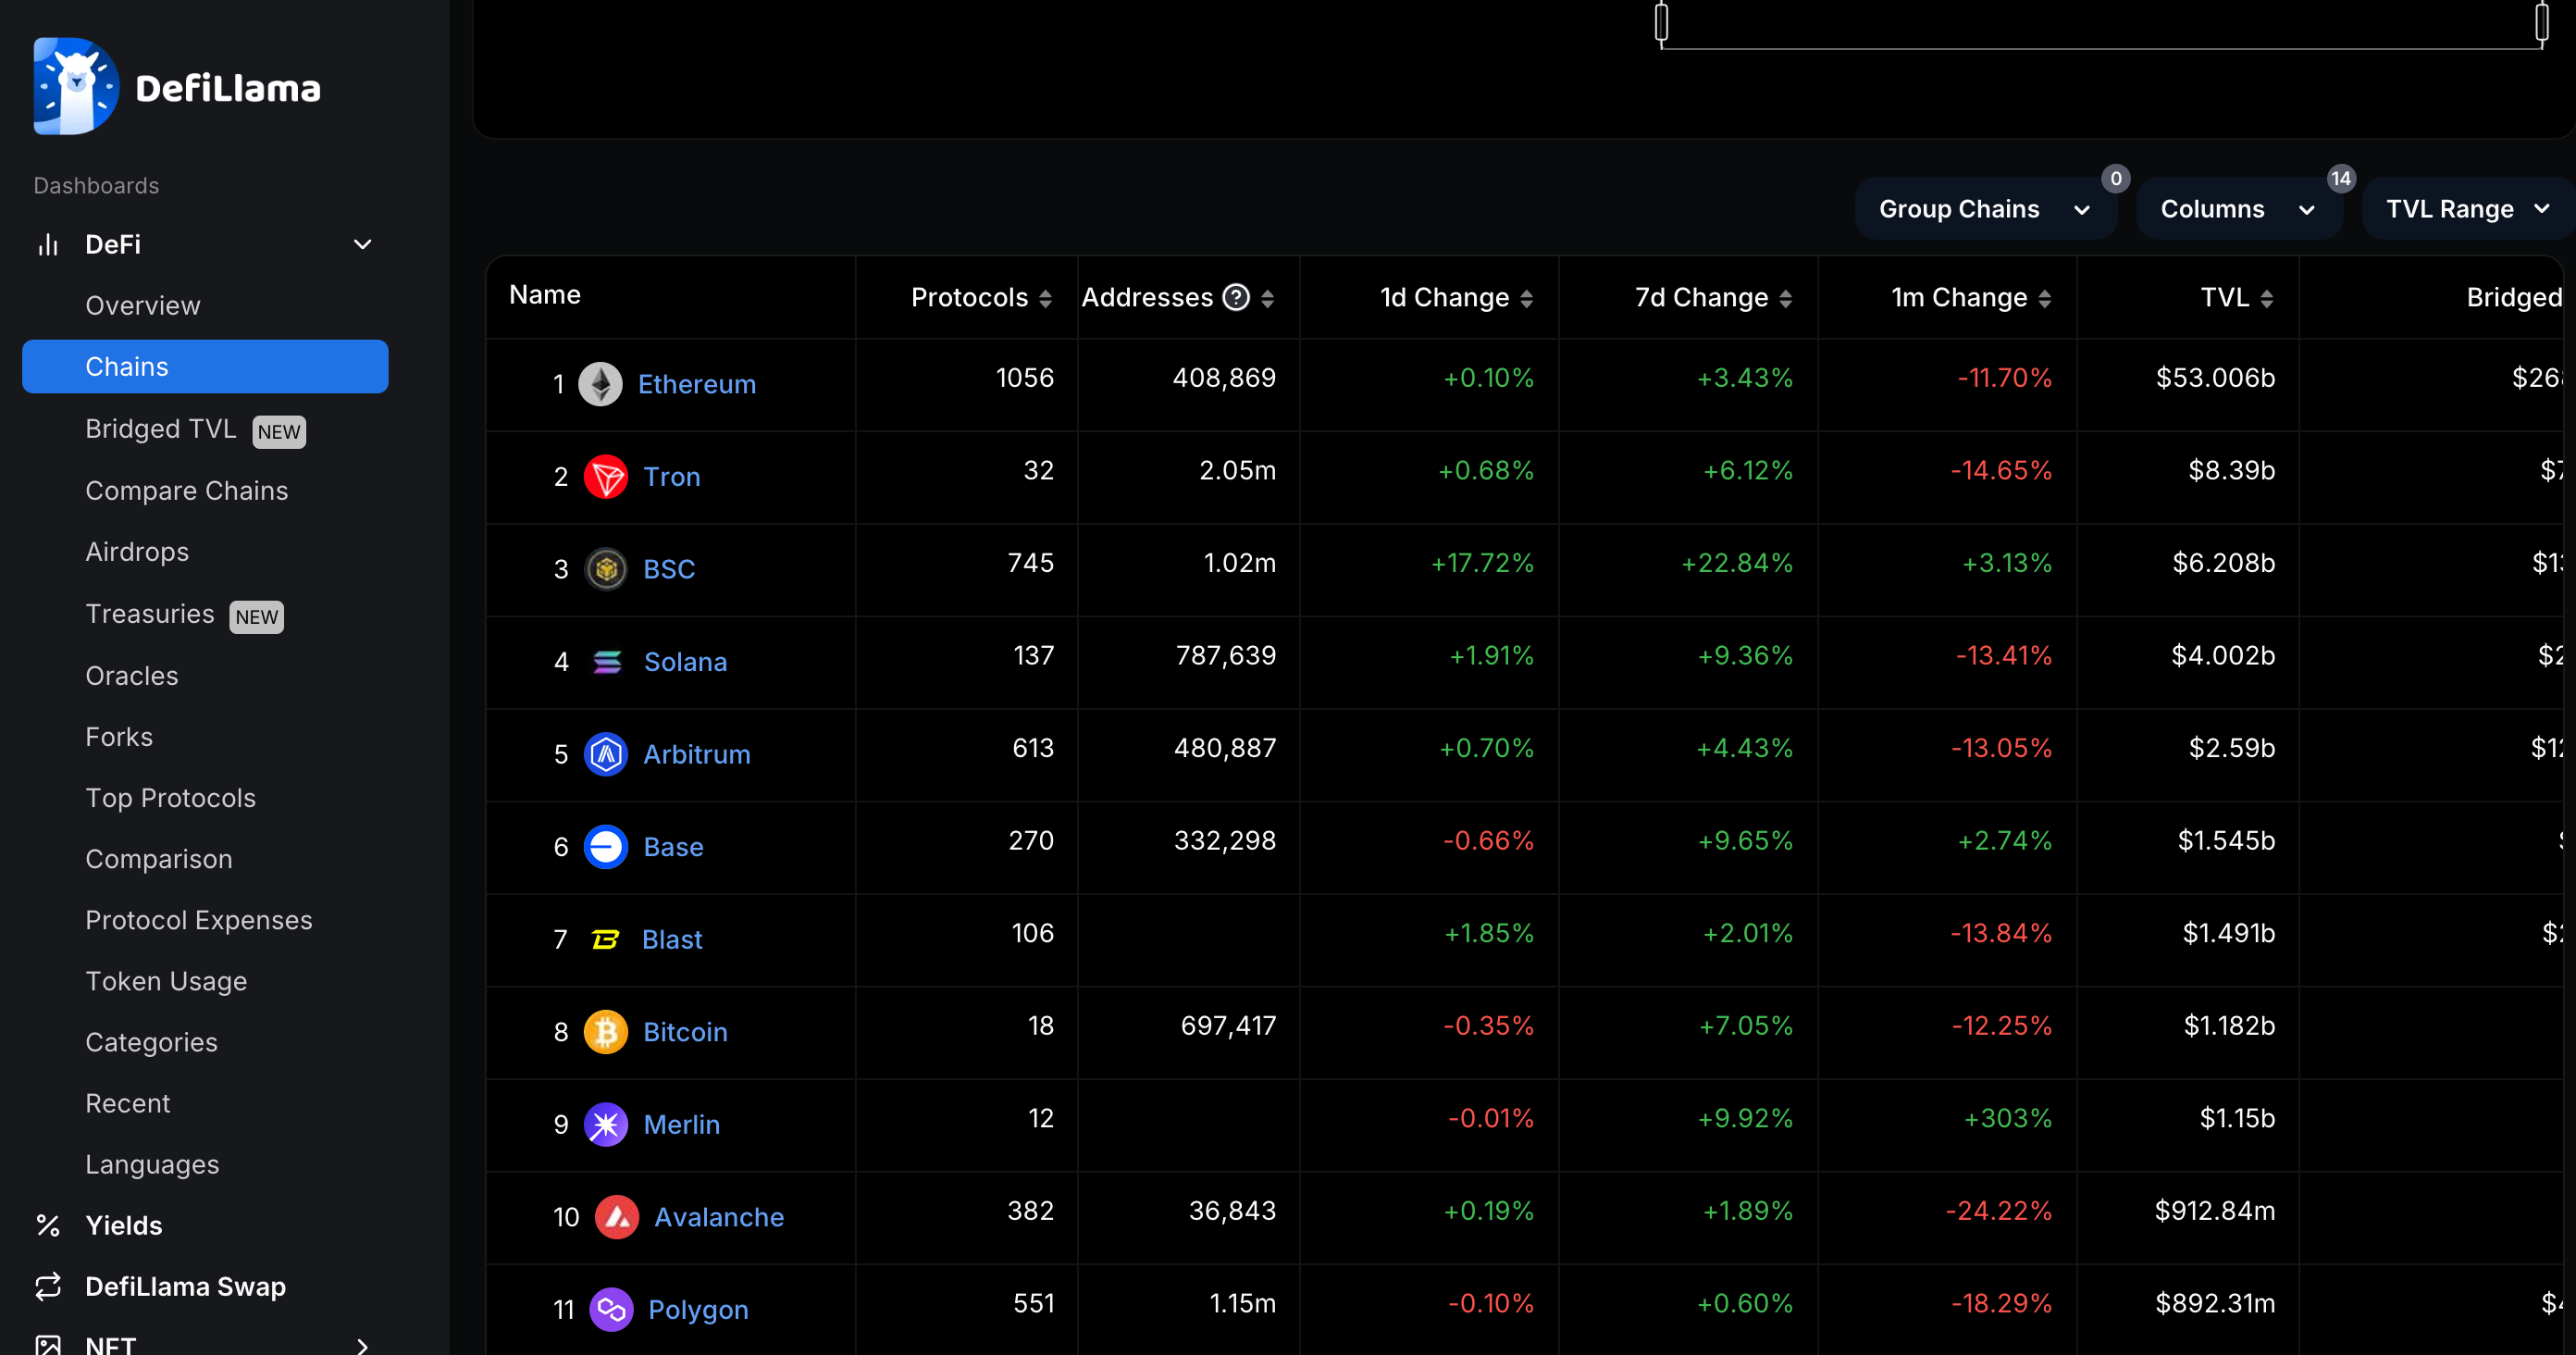
Let’s focus on the top four projects. Eth, Tron, Bianace and Solana. These are the chains that boast the highest amount of total value locked. This is arguably the single most important metric to know about the projects you are considering investing in. TVL is one of the harder metrics to fake and if you look at each of these top-ranking four chains by TVL each is in a bull trend against their BTC pairing, signifying strength for future outperformance. Coincidence, I think not!
In future reports, we will look at these charts and I will show you the correlation between high TVL and performance versus the rest of the market. Typically high TVL projects tend to outperform the general market.
User Activity and New Wallets Created
Tracking user engagement and the creation of new wallets provides insights into the project's adoption rate and user base expansion. An upward trend in these metrics usually denotes heightened interest and a potentially sustainable project. This is a notoriously difficult metric to track accurately many people just lean on TVL as the more important metric but you can look at things like dex volume against other chains to see where the majority of liquidity is flowing right now.
Fully Diluted Valuation, VCs & Market Makers
Understanding fully diluted market cap and the role Venture Capital and Market Makers' have in crypto. VCs are a net positive and the industry and wouldn’t be where we are without them, they arnt’t as predatory as some may suggest, or at least not to terrible yet. VC’s typically have good intentions and are incentivized to grow the project but they are also going to get their liquidity back if they need to. Market makers are also very important to crypto, you want to invest in a project with solid market makers. Jump is one of the more respective high-frequency trading firms that provide market maker services. The best projects have the best market makers and the most established networks typically have a high fdv ratio meaning the majority of thier circulating supply of their token is currently circulating. You want to watch out for new shiny tech coins with a low fdv ratio because this means there are still a lot of token unlocks that have to hit the market and dilute supply which can lead to poor performance. Sometimes FDV doesn’t matter and people look past it unknowingly but it’s important to be aware of and understand who is backing the project.
Team, Tokenomics, Exchange Listings & Real World Partnerships/Sponsorships
Investors venturing into crypto should consider these factors beyond just price. A strong team with relevant experience is crucial. Look for clear tokenomics with a well-defined use case for the project's token. A balanced allocation of tokens towards development and a focus on utility is ideal. Reputable exchange listings and real-world partnerships with established players add credibility. Don't forget to gauge the project's community engagement and roadmap. By considering these aspects alongside FDV, VC involvement, and market makers, you'll be better equipped to value crypto projects and make informed investment decisions.
Technical Analysis
While fundamental analysis establishes a base for understanding a project's potential, integrating technical analysis can profoundly enhance trading decisions. By assessing projects that are in a bull market trend against their BTC pairs, investors can align with positive momentum.
Market Trend Analysis
Identifying projects in a bullish trend against their BTC pairs is crucial as it signifies strength and investor confidence in the project relative to the broader crypto market.
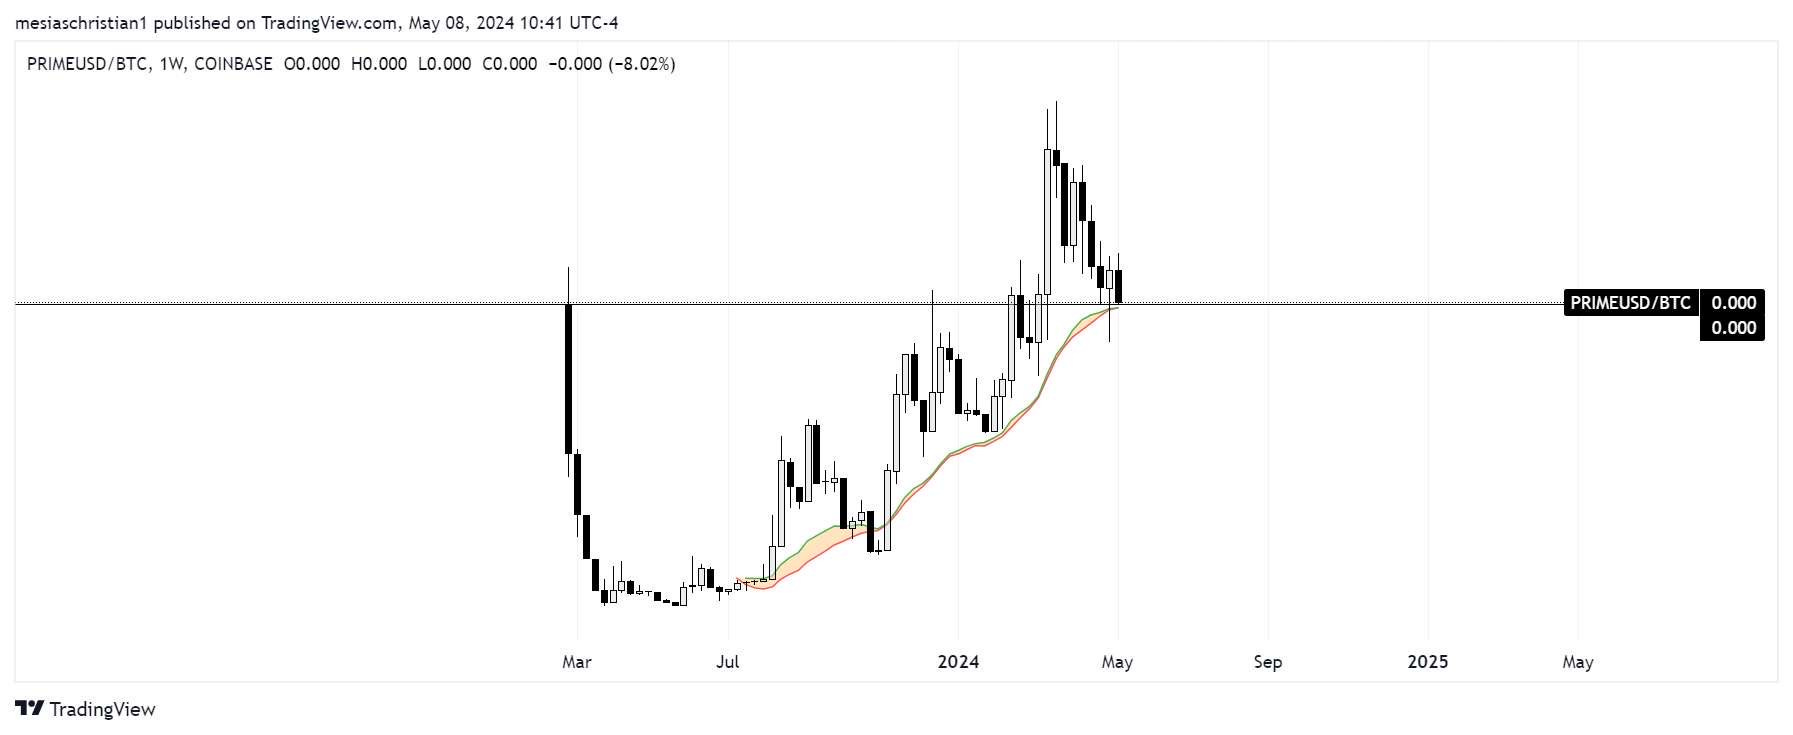
We can see an example here with Prime. Look for charts like this because if they are showing this level of strength against thier btc pair they could likely be a winner. Check out the Solana, Akash and Render charts as well against thier btc pair as well for more examples. Applying the fdv rule from above try to look for the project that has an fdv ratio close to 1.0 meaning all circulating supply is on the market.
Fibonacci Retracements
This tool is invaluable for determining high time frame levels and demand zones within larger market trends. By identifying potential support and resistance levels, investors can pinpoint optimal entry and exit points, effectively managing their market exposure.
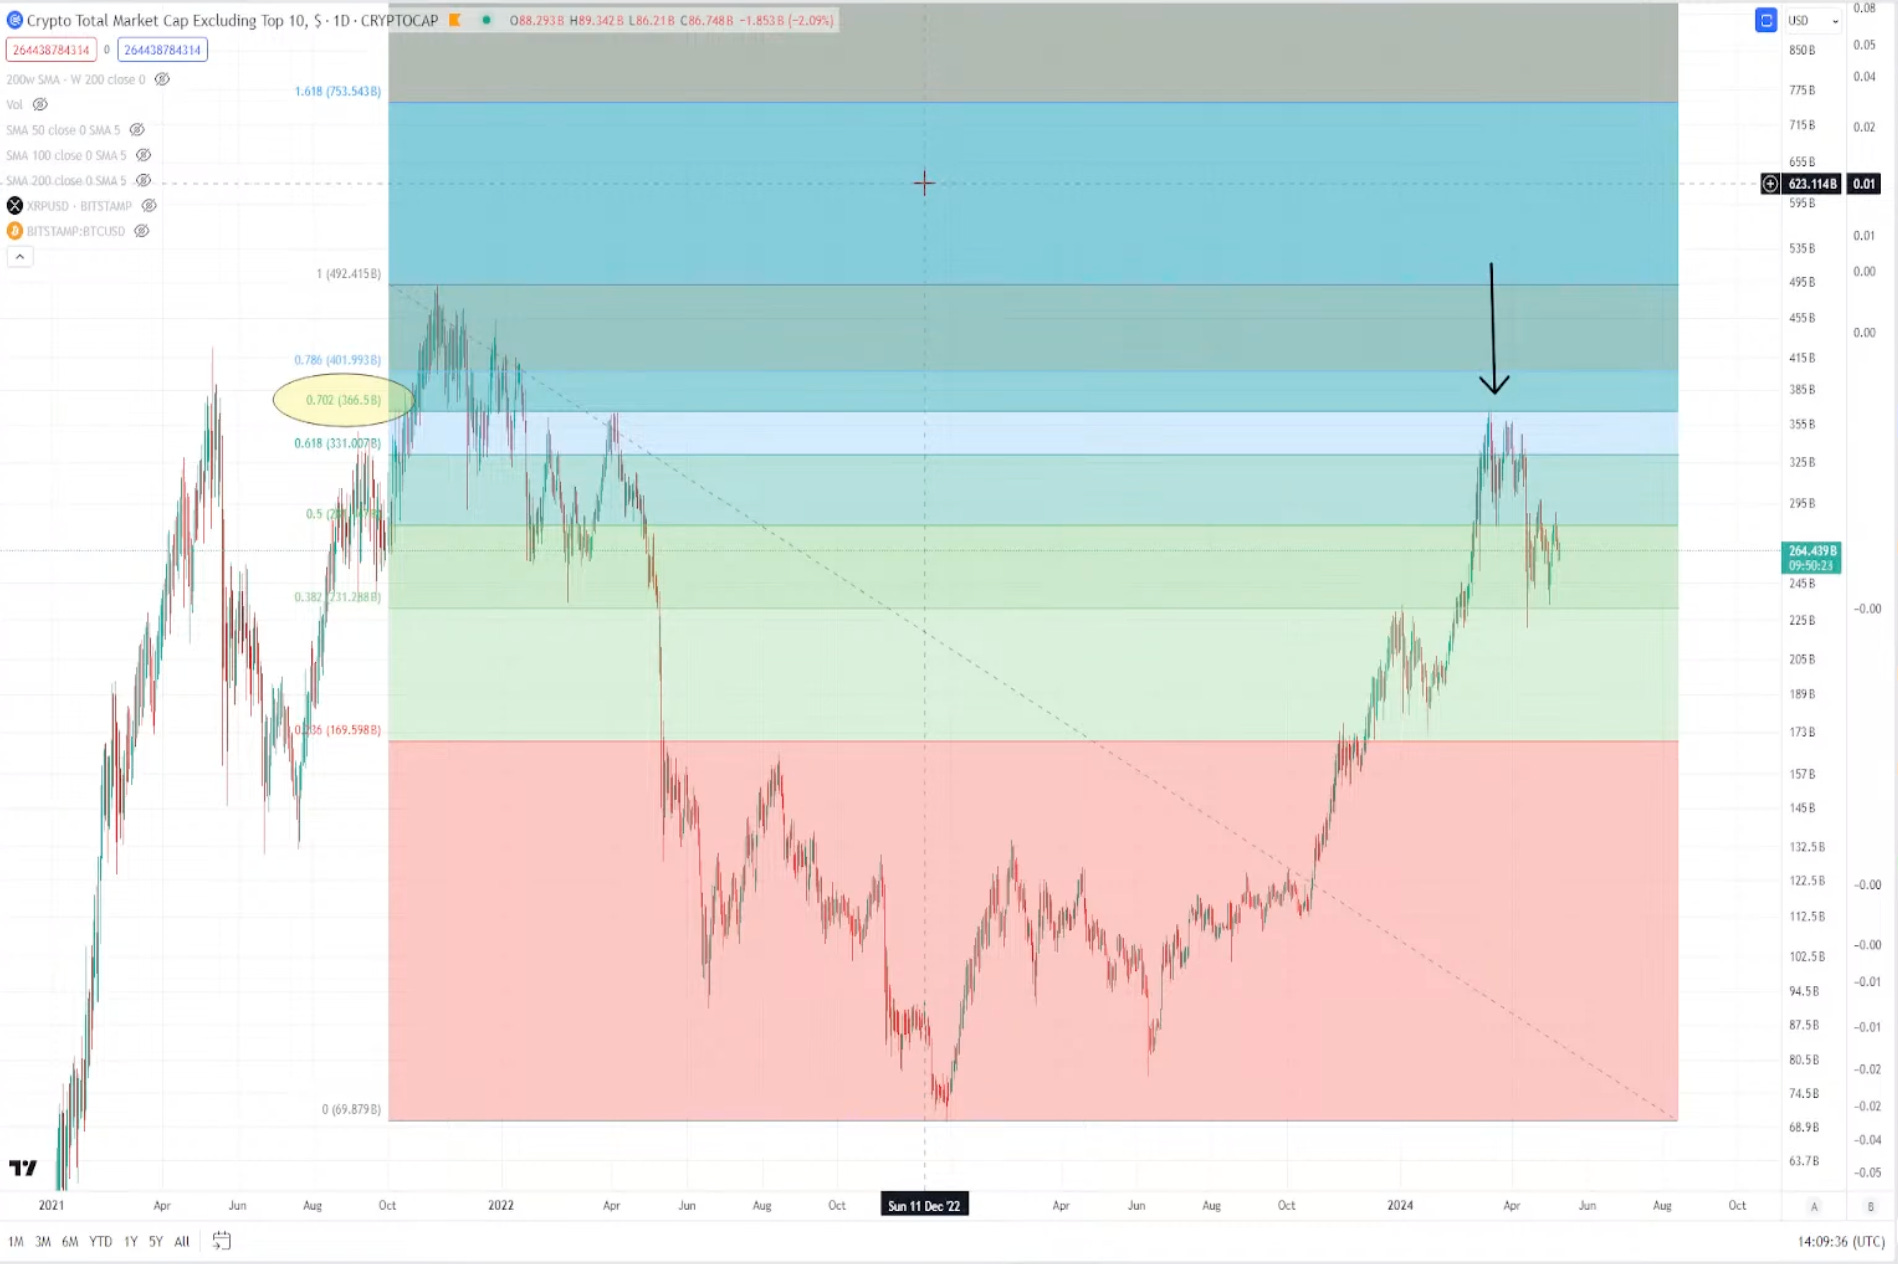
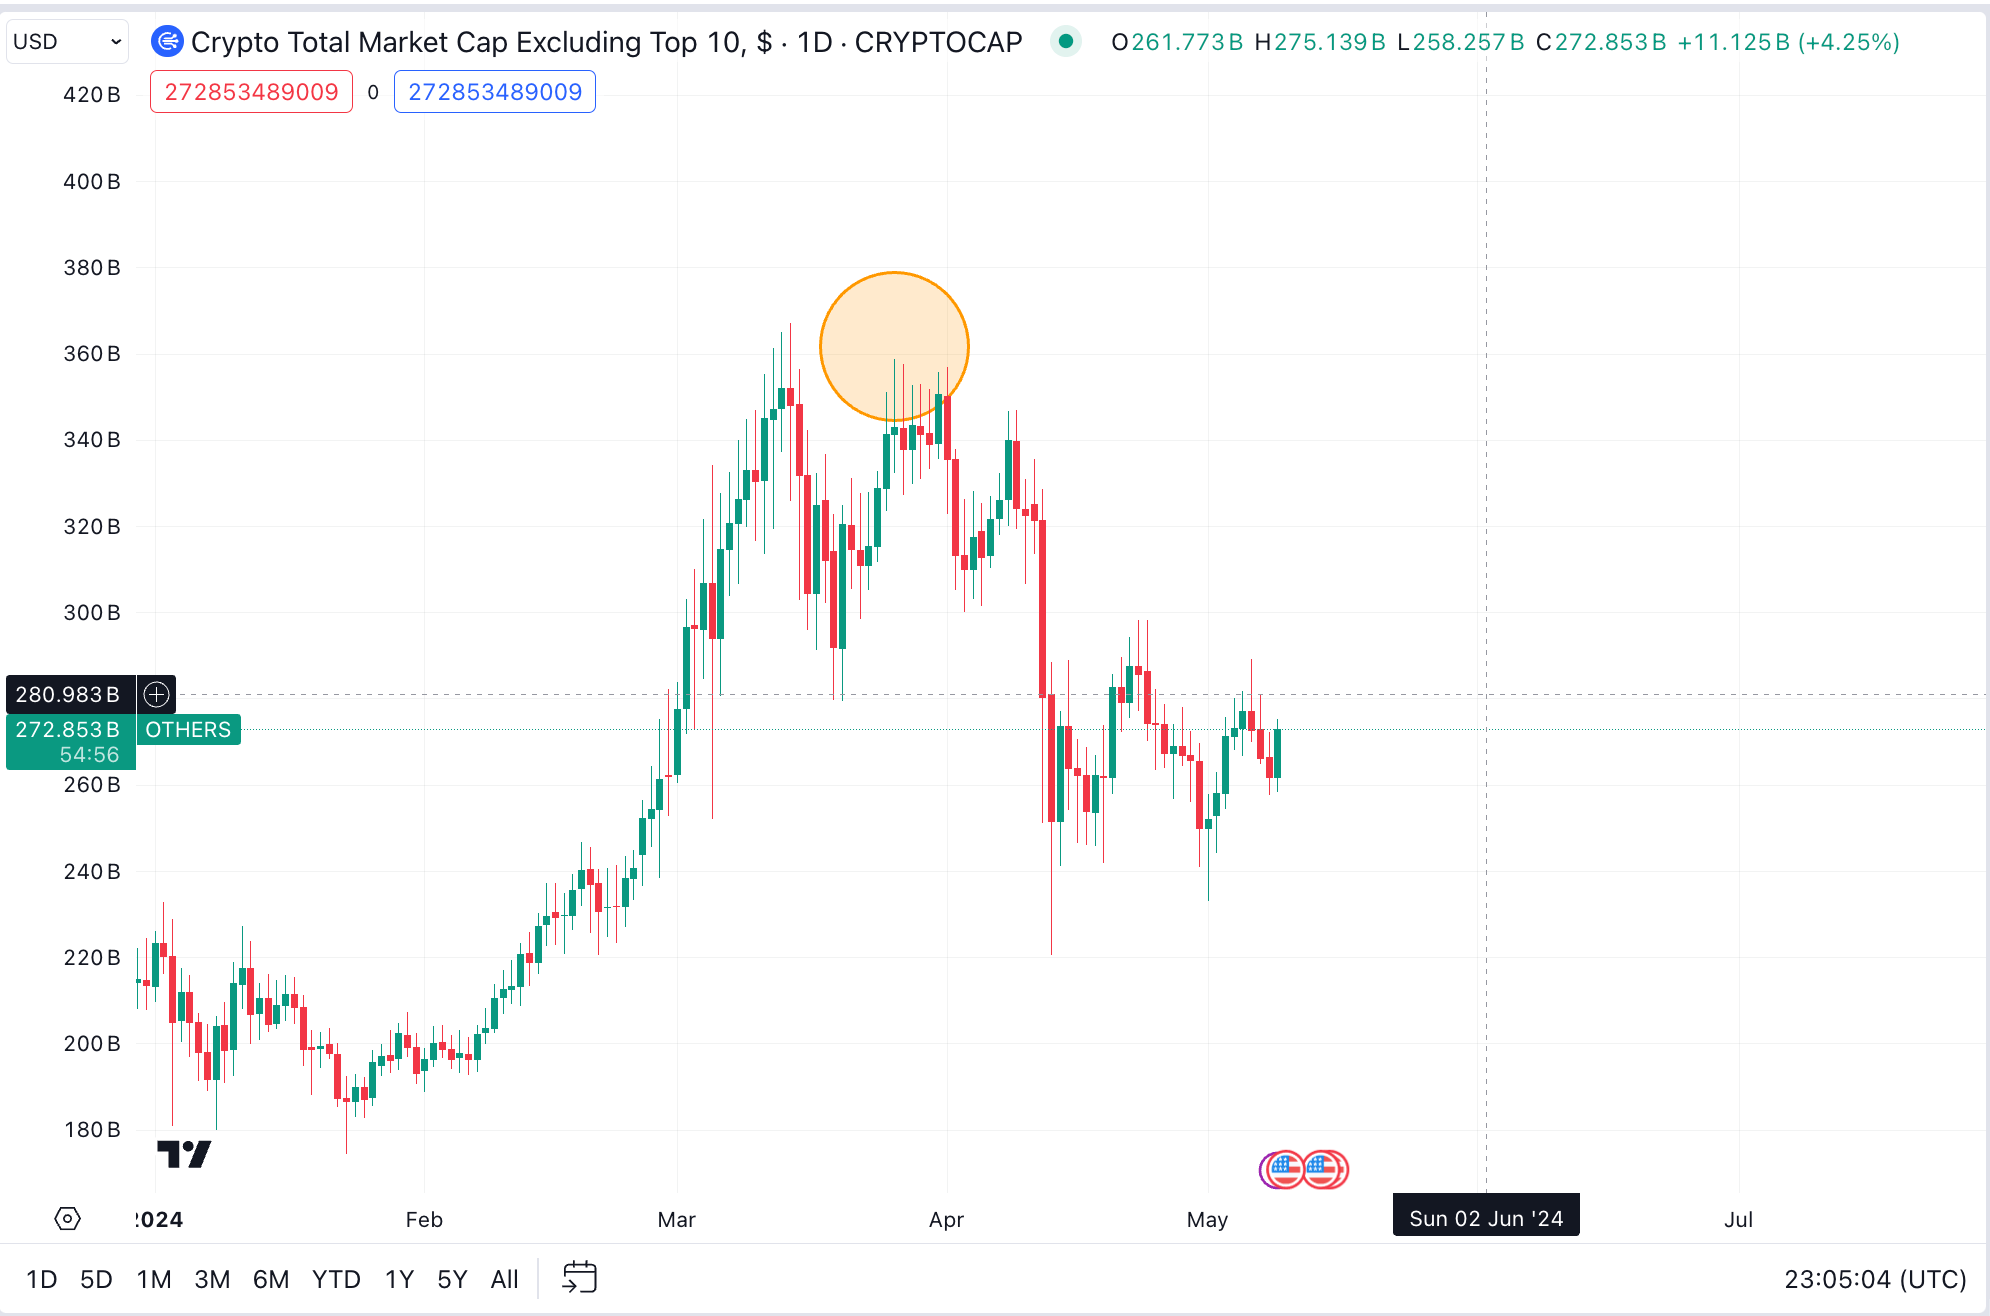
Understanding how to use Fibonacci charts can help you understand larger time frame moves for example the most recent rejection from the 702. retracement. This is historically a difficult level to break out of the first time around and it’s quite normal to be rejected here and remain a bullish trend. The takeaway here is that we need to see the entire altcoin market expand together to get a true bullish breakout and impulse upwards to around 1.55B mc for others excluding top 10. Otherwise, if we reject the .702 again we could see an extended bleed into another long accumulation. Understanding the Fib tool can help you get a feel for market participant psychology as well and help you stay ahead and informed if you take the time to study and apply them.
Gann Charts
Gann's methods, which emphasize the geometric and numerical relationships between price and time, provide a unique perspective on predicting price movements based on historical data and market cycles.
Founder of 1995 Digital Asset Research Stefan Cox is one of the most distinguished Gann analysts at the moment. He has had one of the best reads on this cycle in my opinion. Def don’t check out some of his work and free videos pinned at the top of his substack -
Here is a clip from May 1st where he is calling potential local bottom coming up in late May specifically highlighting May 12th! Be sure to write that date down. Stefan breaks down the types of candles to look for and what they indicate as price and time intersect, check out his strategy on a fundamental level here.
Macro Markets Cycle Analysis
Having a keen ability to understand macro markets at large and ride the ‘risk on’ trend that is crypto, and is one of the tried and true strategies to playing this game. And mind you this is all a game, for all you know the majority of this stuff could likely be vaporware. Until they have users and a sustainable economy with more attractive yield and spending than trade then it’s an uphill battle but ultimately crypto will win, I am optimistic about this.
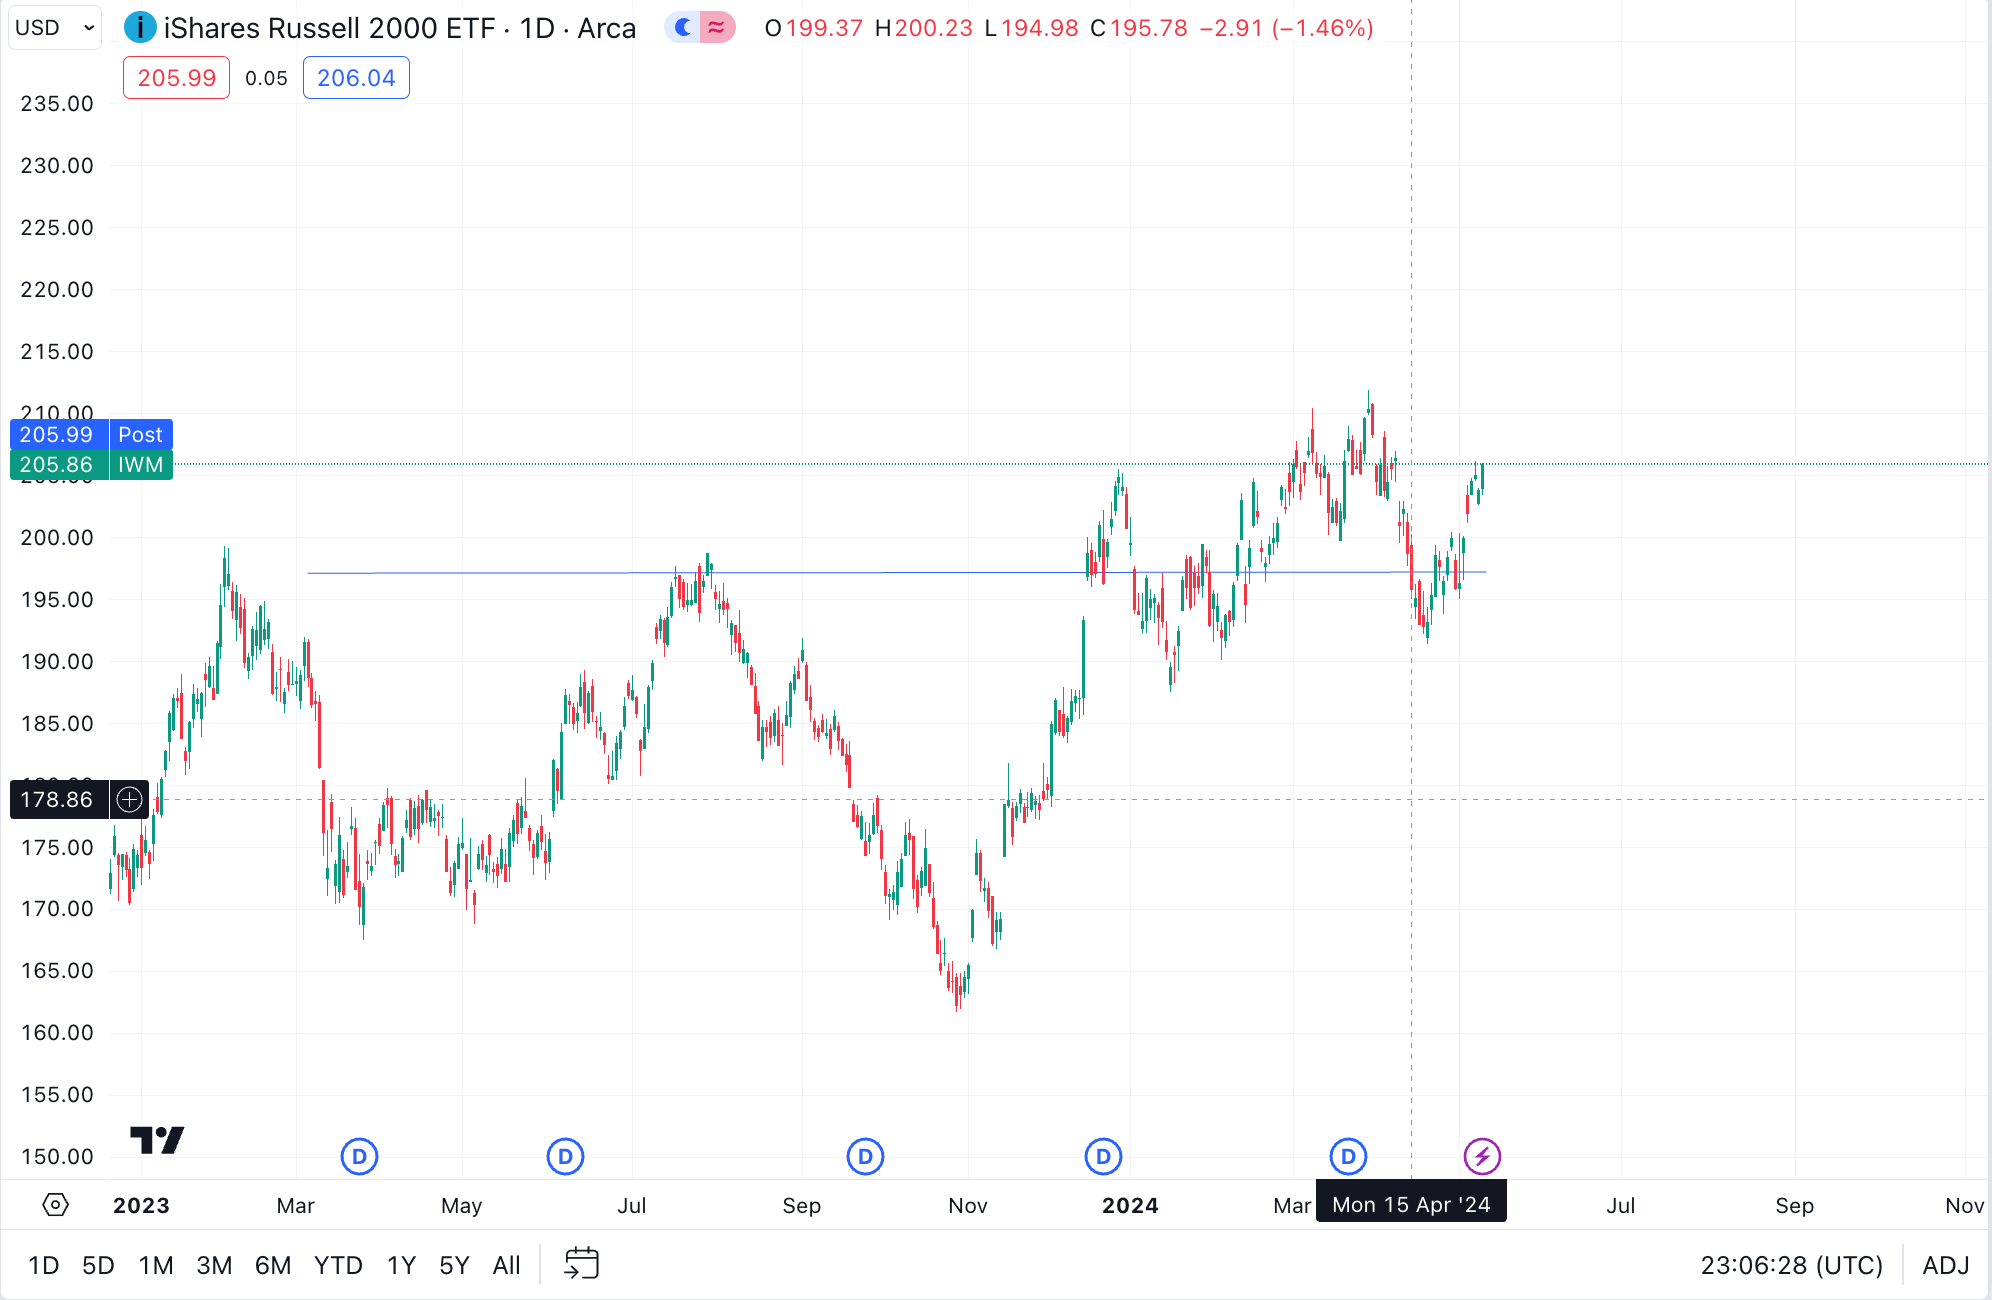
I simply can not stress the importance of understanding timing and when the time is to go risk on and that’s when is both the equity markets and crypto going to expand together. As I have pointed out in previous reports BTC merely trades like a tech stock (aka NDX Tech Index) more than a new form of money or whatever narrative moonbois have out there. Alts and $Others charts have a high correlation with the Russel 2000. So given this info we can try and look at the Russel to give us an indication of when to go risk on aka invest in alts instead of trying to preserve capital in the majors btc, eth, and stablecoins. You didn’t come to crypto to make a 50% return on btc or a 210% return on eth you likely came for the 5 to 10x’s, this is where portfolio strategy comes into play, and contextualizing the opportunity that is being long alts as btc.d+eth.d+usdt.d+usdc.d falls more on this below.
Here is the $Others and Russel 2000 together
None of the above indicators are even useful unless we are in a favorable environment for altcoins. I like to use this safety trade chart as well which combines btc.d+eth.d+usdt.d+usdc.d to give me a more detailed reading on the safety trade and when you get long alts as a trend. This chart helped me nail the bottom on October 23’ and also helped me have an idea of the market as we whole that isn’t so consensus and reliant on using just btc.d for example. I used this because Eth and stables now represent the safety trade of this cycle so it’s only right to include those as well for more detailed analysis of wen the true alt season is. Let me tell you it looks to be very soon based on my scribble artwork on this chart.

Credit, Bonds, GDP Interest Rates, Inflation & Unemployment
- Just having a general awareness of macro market conditions is important for any investor. You always want to align yourself with the trend instead of against it. If the economy were going to fall off a cliff it would’ve done so by now. The rich are still flush with cash in equities and real estate while the middle and lower classes are struggling to make ends with all-time high rents and credit card debt. Interest rates are also high, making it difficult for real estate transactions and new developments to get done. Unemployment data has been promising but many argue the data is cooked. All in all the market dynamics are important to be aware of so you can fade the general majority of market participants. Remember the market can also stay irrational longer than you can stay liquid so the key here is don’t fight the trend and don’t fall into the consensus fud narrative that we are going into a recession because the economy looks quite strong at the moment. Higher for longer, in all aspects lol.
Social Sentiment & Crypto Cycle’s Equity Correlations
Last but not least I wasn’t going to include this because this report is getting dense but I feel obligated. Here are 3 important social indicators.
Shoe shiner boy indicator
Irrational Exuberance, if you remember my Fibonacci chart above you can see firsthand how price impacted emotions and everyone got bullish at the top in mid-March. If you want to become an above-average investor you need to be able to fade sentiment on a dime and by default your own emotions as well. It never feels good when you are selling when everyone is holding hands and dancing in a circle but it’s what must be done. Same with buying, it never feels good to make an entry after a 50-80% downturn but that’s where the opportunity presents itself. You get the point, I just share this with you because if we get this blow-off top the bullish sentiment is going to be so crazy everyone and their milkman will be talking about crypto. This is known as the ‘shoe shiner boy’ indicator when everyone turns into a degen and trades memes. We have already seen phase one of this, will be we phase two and three is yet to be seen but if I were to simplify it down to a bet against increasing degeneracy over the next 3-to 6 months then I think phases two and three are just around the corner for memes. If you ever brag to anyone about profits sell right then and there.. for this is the best indicator of all. You gloat you sell, I don’t make the rules.
Market Sentiment & Cycle Phases
Understanding market sentiment and its impact on cycle phases is a critical component of comprehensive market analysis. For instance, Bitcoin reaching a 4.236 Fibonacci extension from its 2018 cycle peak suggests we may be experiencing larger "supercycles" rather than traditional four-year cycles. This insight into the broader market cycle can influence decisions on entry/exit strategies and overall portfolio strategy.
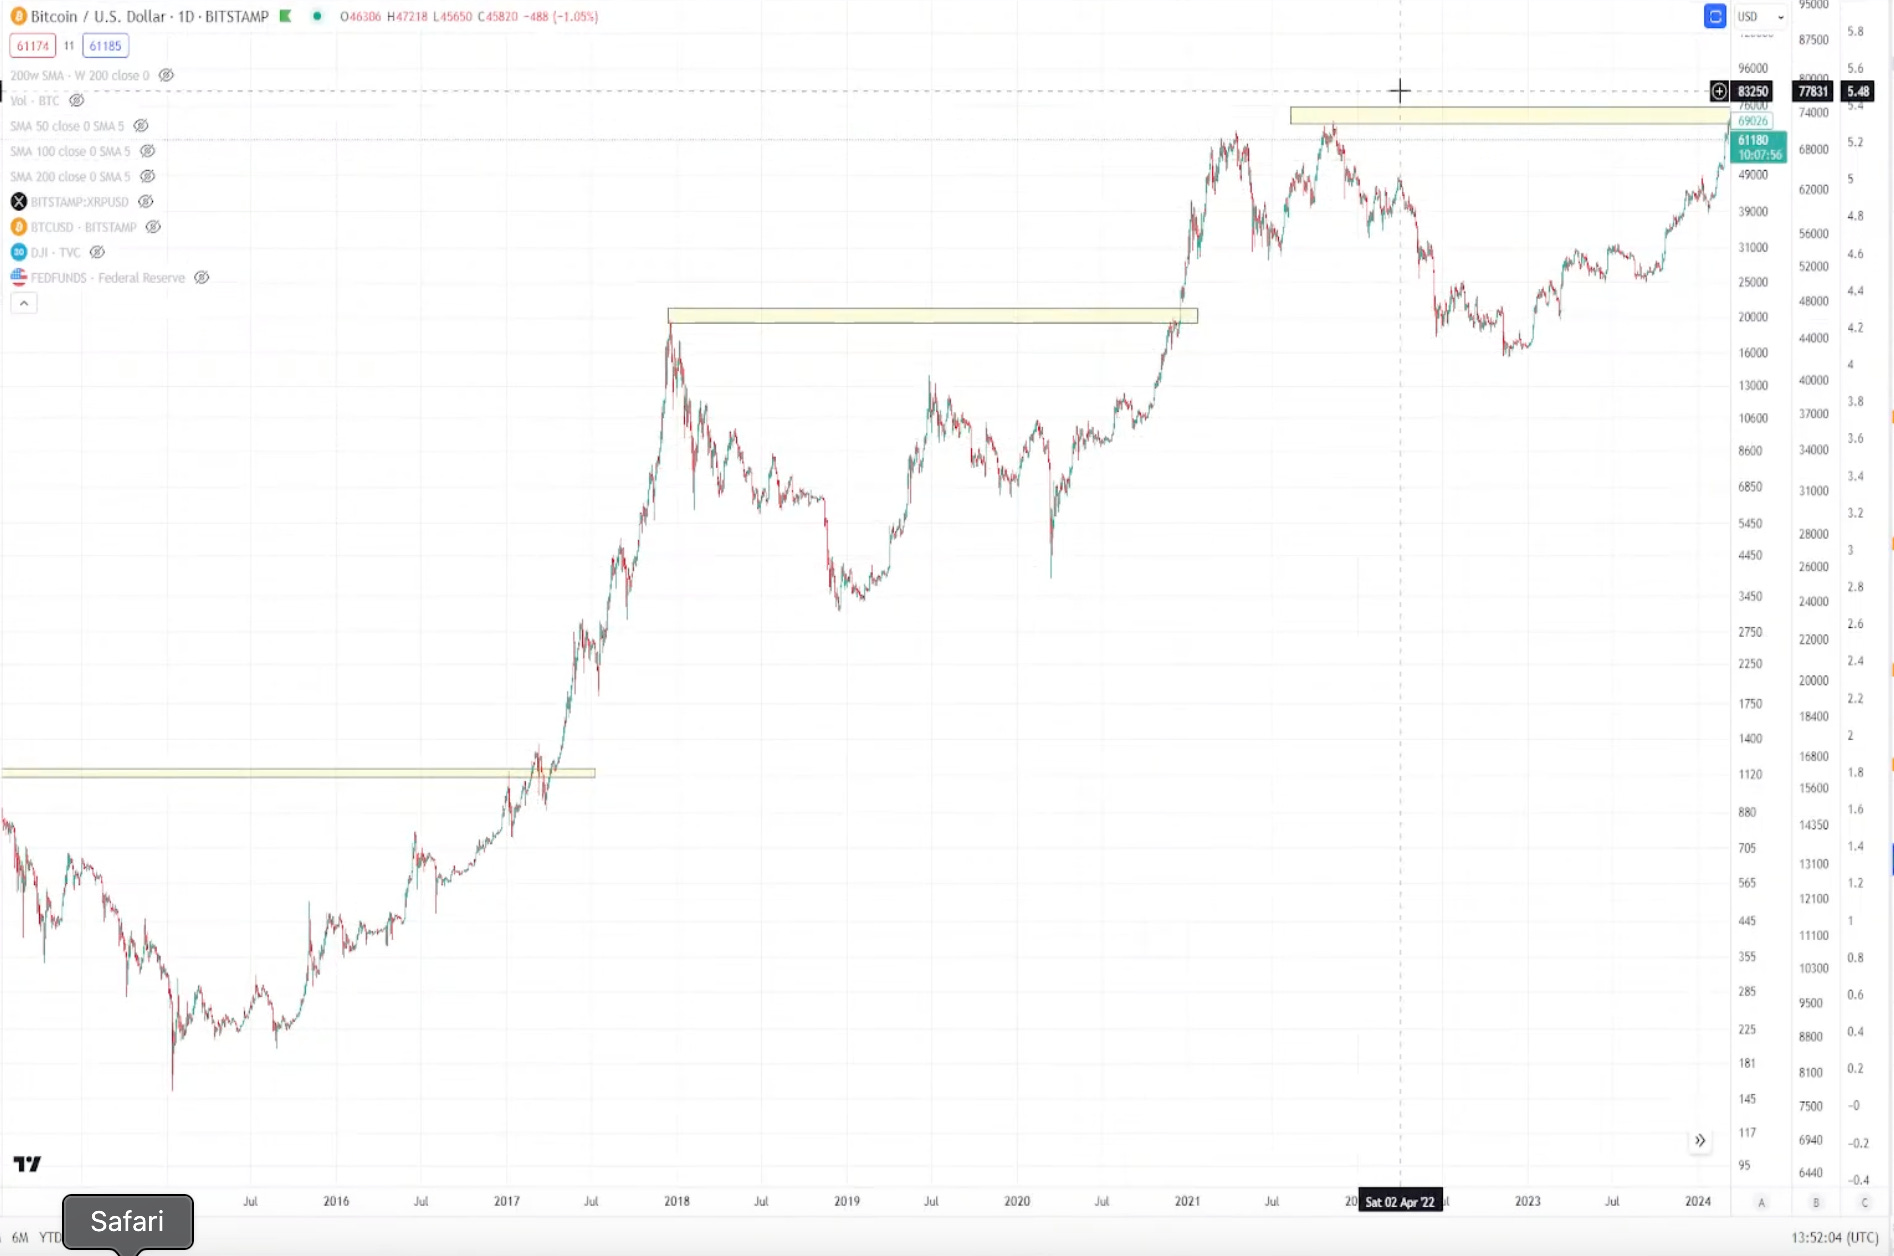
The chart above could suggest the price action we have seen since October now is more similar to Jan - July 19’ meaning Btc merely did a retrace from its technical top on April 21’. This could support claims of an extended correction given meme coins also had thier highest volume in March potentially signaling a longer-term top and breakdown plus chop to wash out the exuberance we just experienced. Everything depends on equities so if continue to chop you should expect crypto to do the same. Yet, if Ruseel 2000 breaks out and we start to see some breadth open up in equities I would expect the same for the $others chart and the altcoin market in general.
Last but not least, I have spoken a lot on narrative and outperformed, generally this doesn’t matter as the whole market moves together. You would almost be better off focusing on finding solid projects with high dev activity, tvl and 1.00 fdv’s. These fundamentals are more important than narratives because at the end of the day historically the risk markets all moons together while dxy falls. We just do what we can to catch trends, arrive at narratives early, and continue adapting, learning, and strategizing.
Please like and comment on your favorite takeaway. Cheers 🥂
If you ever have questions be sure to comment below and will do my best to answer.