Safety Trade Update, On The Cusp of Alt Season Based on Time Confluence
In this report I want to revisit the safety trade and provide an update. By the end of this report you should have a deeper understanding of how the safety trade itself, how it can help you predict..
Safety Trade Update
1In this report I want to revisit the safety trade and provide an update. By the end of this report you should have a deeper understanding of the safety trade itself, how it can help you predict alt season, and last but not least where we currently are in the safety trade. So let’s dive into it.
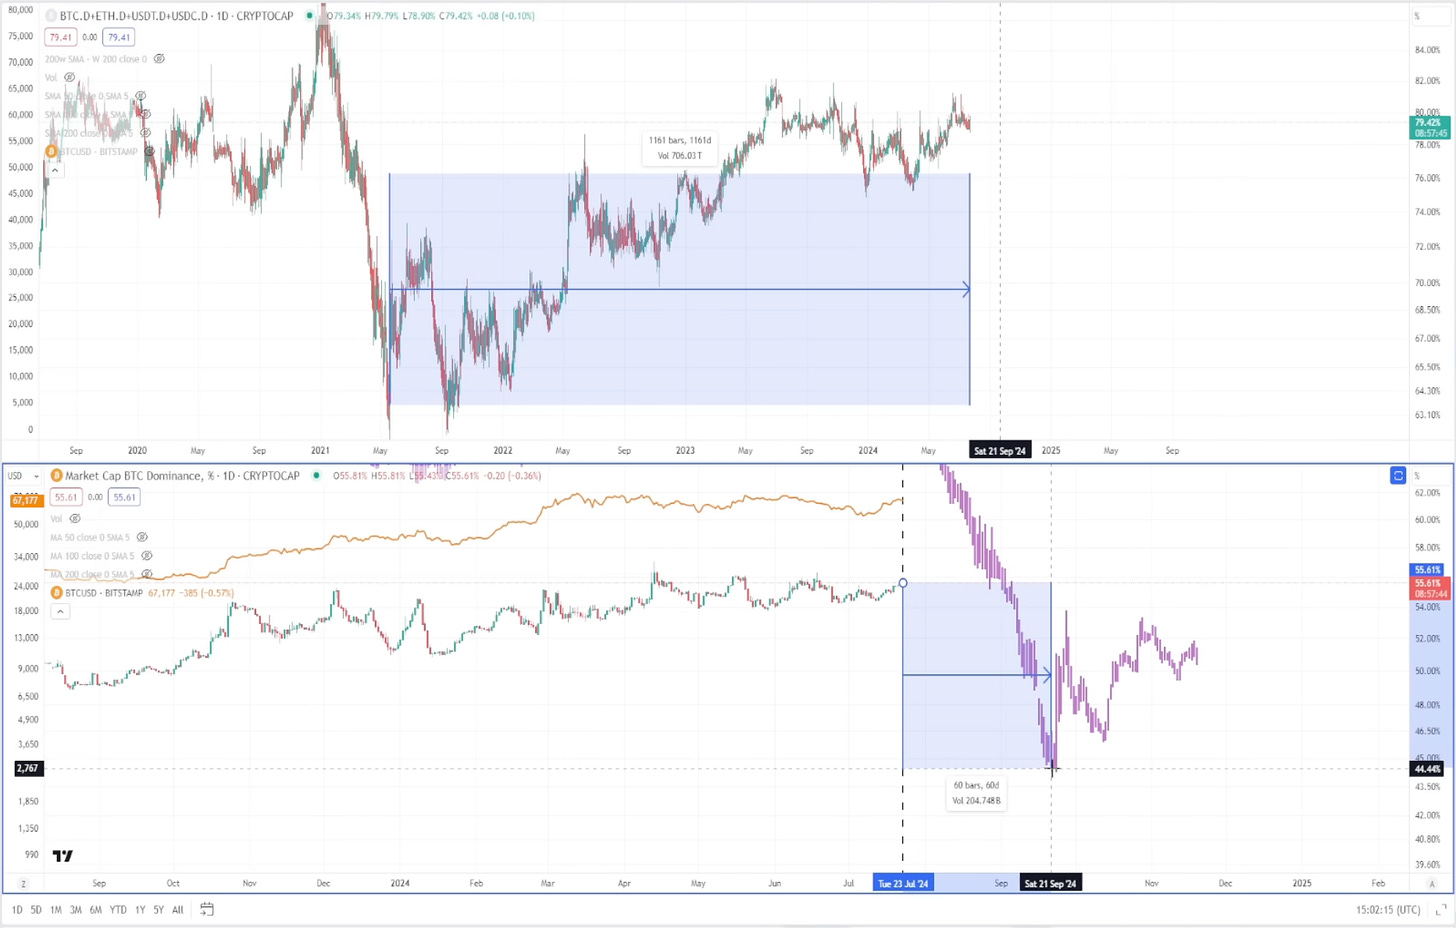
The safety trade of this cycle can be measured by combining Bitcoin, Ethereum, USDT (Tether), and USDC (Circle) dominance all into one chart. Let’s start with the first chart above where we are comparing the current safety trade with the safety trade from the 2018-2021 cycle (btc.d). When comparing the two you can notice it has a similar pattern, note they share a similar red box that indicates BTC capitulation and the bottom, notice also the similarity between the dotted verticle lines which indicate the exact moment of each cycle where altcoins bottomed against thier BTC pair. The safety trade chart for this cycle has been one of the most helpful charts to understand better when it’s time to go risk on and when overlayed on top of each other we can glean some compelling insights.
One of the most fascinating insights about the safety trade comparison in the chart above is the amount of time we have spent consolidating. Take a look at the chart above and you will notice we are currently sitting at 1161 days from May 7th, 2021 which marked the technical top for BTC and the majority of alts last cycle. It’s important to note that many debate the top date of the last cycle, I tend to be in the camp that the top was in on May 7th, 2021 because this is when the majority of altcoins topped as BTC price and dominance created a divergence that led to risk on aka alt season. Most altcoins never made a new all-time high after this and were rejected at their .702 retracements when that 2nd top was put in late November of 2021.
Given the similarities in the Saftey Trade chart structures and in the time spent consolidating (1161 days) one could make the argument that we may be quickly approaching alt season. In the 2018-2021 cycle, you can see from the EXACT moment we are at RIGHT NOW there were only about 60 days left in the cycle before altcoins went parabolic and led to the May 2021 top for the majority of the market. Notice also the divergence in BTC.dominace and BTC price (the overlayed orange line) this is one of the best indicators that Bitcoin is in distribution and not accumulation. Identifying this divergence in dominance and price is the difference between selling the top and buying the top. Say for example in the coming months BTC goes up to 79k let’s say it wicks up there and then slowly retraces the entire move while altcoins are ripping like crazy. Let’s say it retraces to 68k and then is unable to break past 72-74k convincingly, but alts are still going crazy and no one seems to care about BTC anymore. Take this example with a grain of salt, we are just trying to show you the topping patterns to look for so that in the heat of the moment you can stick to your plan, stay composed, and execute. I think the single most important thing I have learned this cycle is that pressing the green buy button is easy, selling not so much. Just make sure you have a plan.
If we were to continue following the 2018-2021 safety trade pattern based on time it would suggest that we are actually 3 days into altseason as I am writing this on July 25th, 2024. If we take the 60-day timeframe the 2021 alt season gave us and apply it to the current safety trade we get September 19th. September 19th also happens to be the projected date for the first FED Rate cut. Historically rate cuts are a sort of ‘Buy the Rumor, Sell the News”, type of catalyst because for example let’s say Jerome Powell (Federal Reserve Chairman) comes on stage next week (July 31st) and says they are going to cut rates in September. This could cause the exact domino effect we need to spark alt season. This would likely cause the DXY to tumble, paving the way for Russel 2000, while the Russel 2000 paves the way for ‘Risk on” aka Alt season. Typically rate cuts get retail bullish again because all risk assets are ripping, everyone thinks rate cuts will be good for markets and the bull run is going to last for another year at least because monetary conditions are loosening but this is not the case. This whole bull run from August 2023 to now has happened on the back of a restrictive credit environment and a lot of stealth quantitative easing via political trickery/policy given it’s an election year. All of this to say that rate cuts are not bullish they are usually mark the beginning of the end as it indicates something is broken in the economy or markets.
Highly recommend checking out this video by Blockchain Backer to learn more about the Saftey Trade, Alt Season, Wen Moon, and much more.
It is gearing up to be an exciting end to the summer, so make sure you are following Digital Asset Research, and keeping an eye on our key dates and projects to watch.
Last but Not Least, As always stay bullish my friends, Cheers We Are Close 🐂🍻
*Disclaimer - This is not investment advice, this is only for education/entertainment purposes.


